It starts with discovery, wherever the engagement begins.
A web form, a referral, an ad, a conversation at an event. However a prospect arrives, AuditFy opens the client record and Nova starts learning the company before anyone has spoken to them.
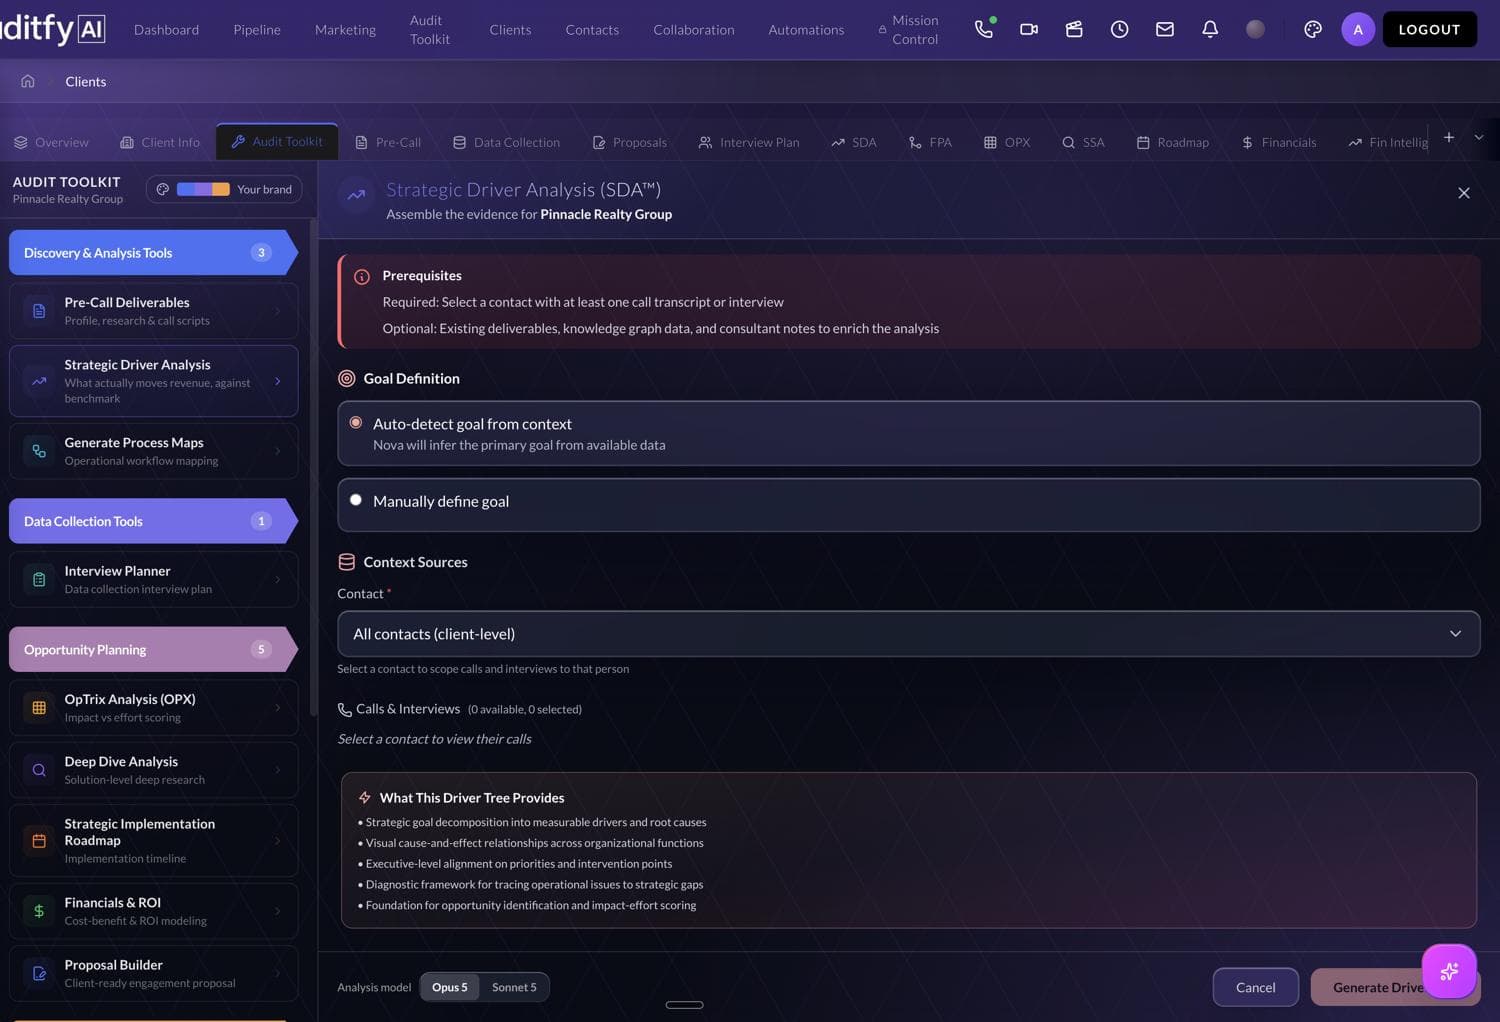
A deliverable for every question the engagement raises.
Twelve deliverables meet the client wherever the engagement is: what drives revenue, where the friction is, which solutions are worth it, what they return. Each one is built from the discovery transcript and the client's own numbers, so they agree from the first page to the last, and the system that follows solves the right problem.
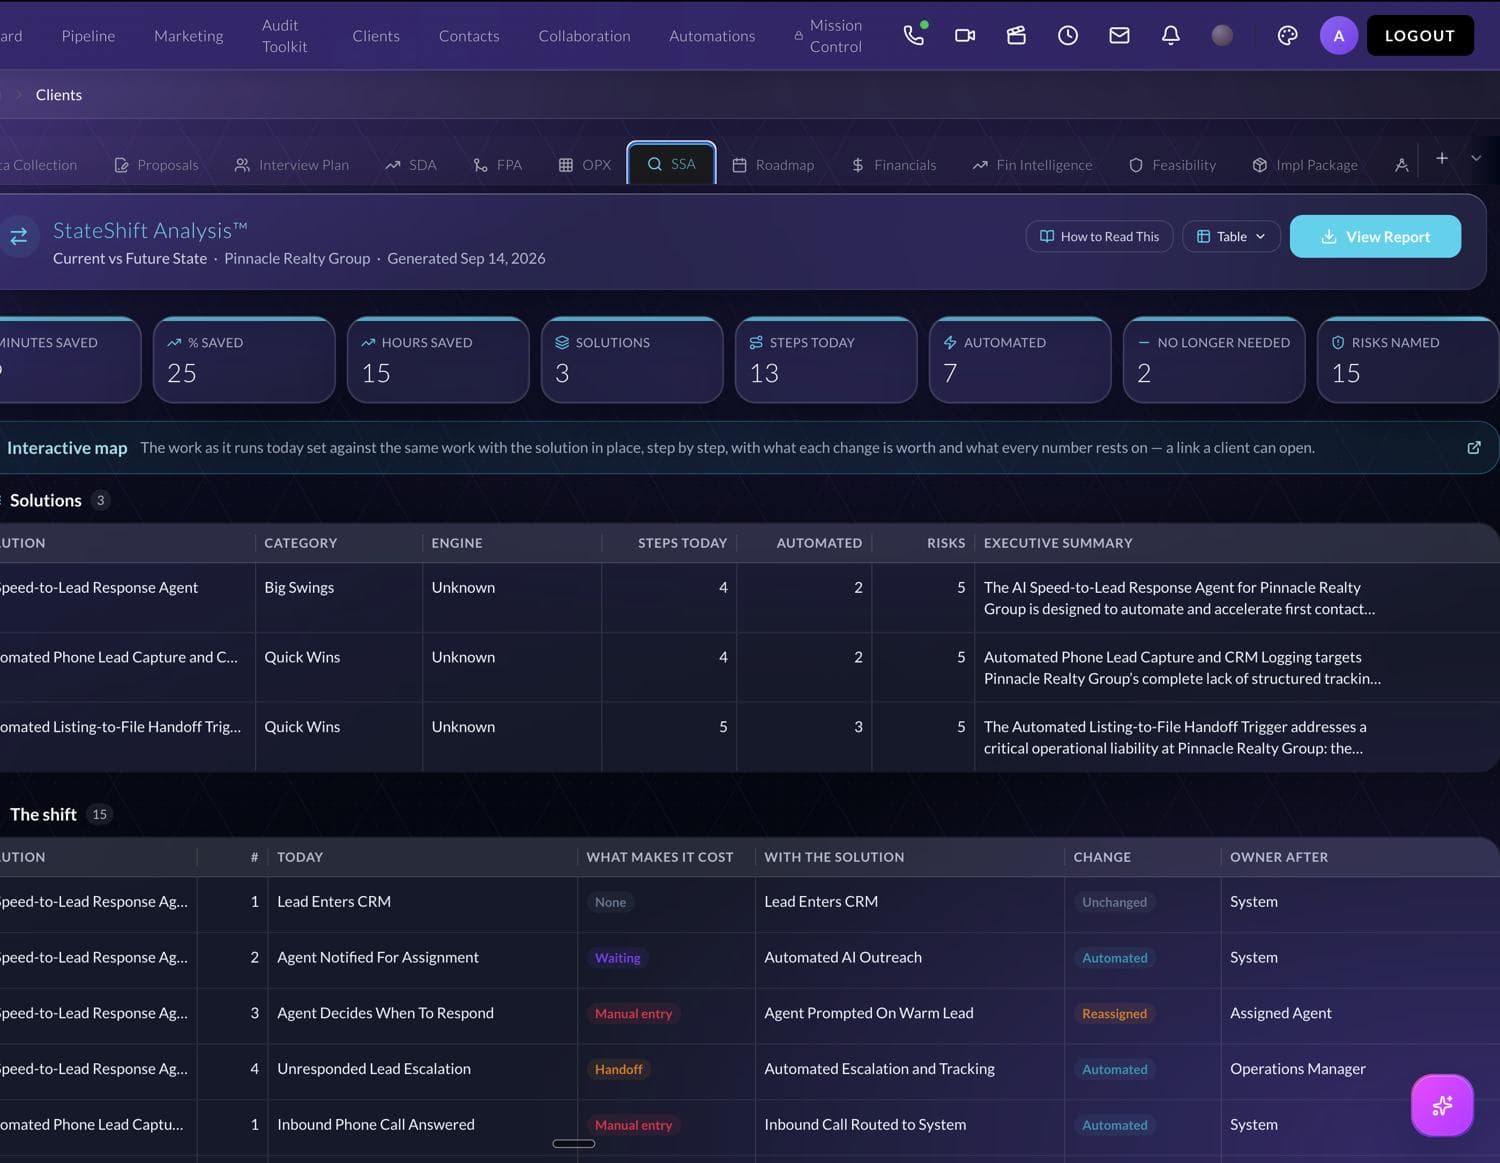
Today's work set against the same work with the solution in place.
Every step a person does now, what it costs, and who owns it after. The client can open the same map.
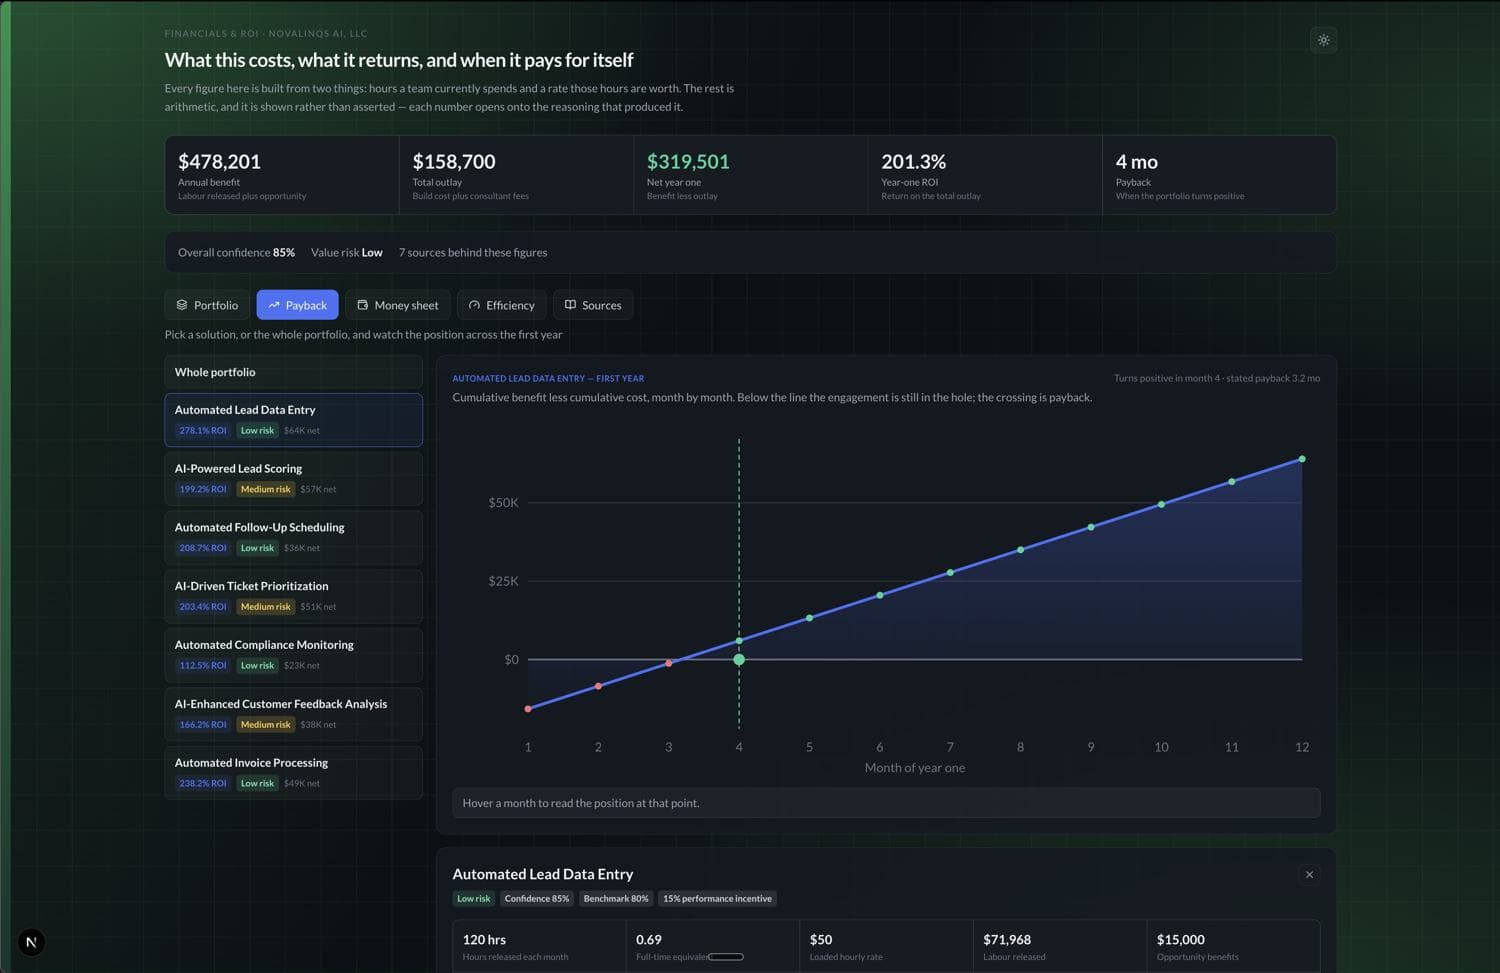
What it costs, what it returns, and when it pays for itself.
Built from two things: the hours a team spends today and the rate those hours are worth. Every figure opens onto the reasoning that produced it.
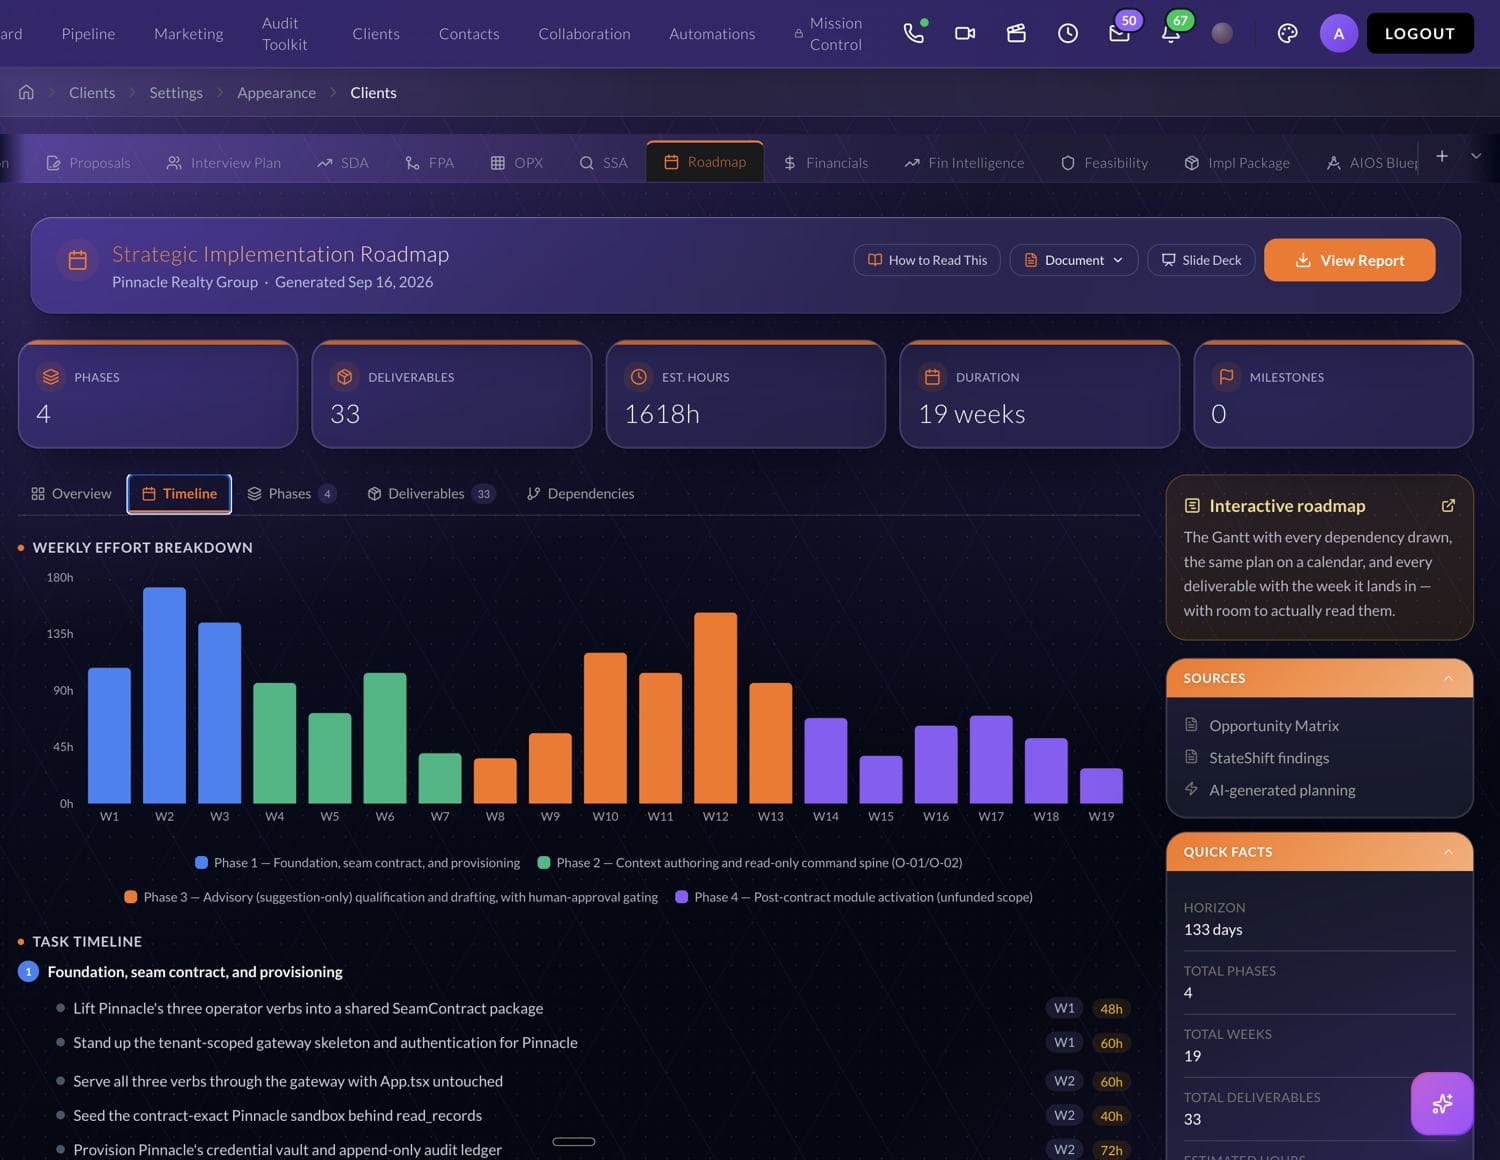
What gets built, in what order, and what decides when it finishes.
Phases, deliverables and hours, week by week, with every dependency drawn.
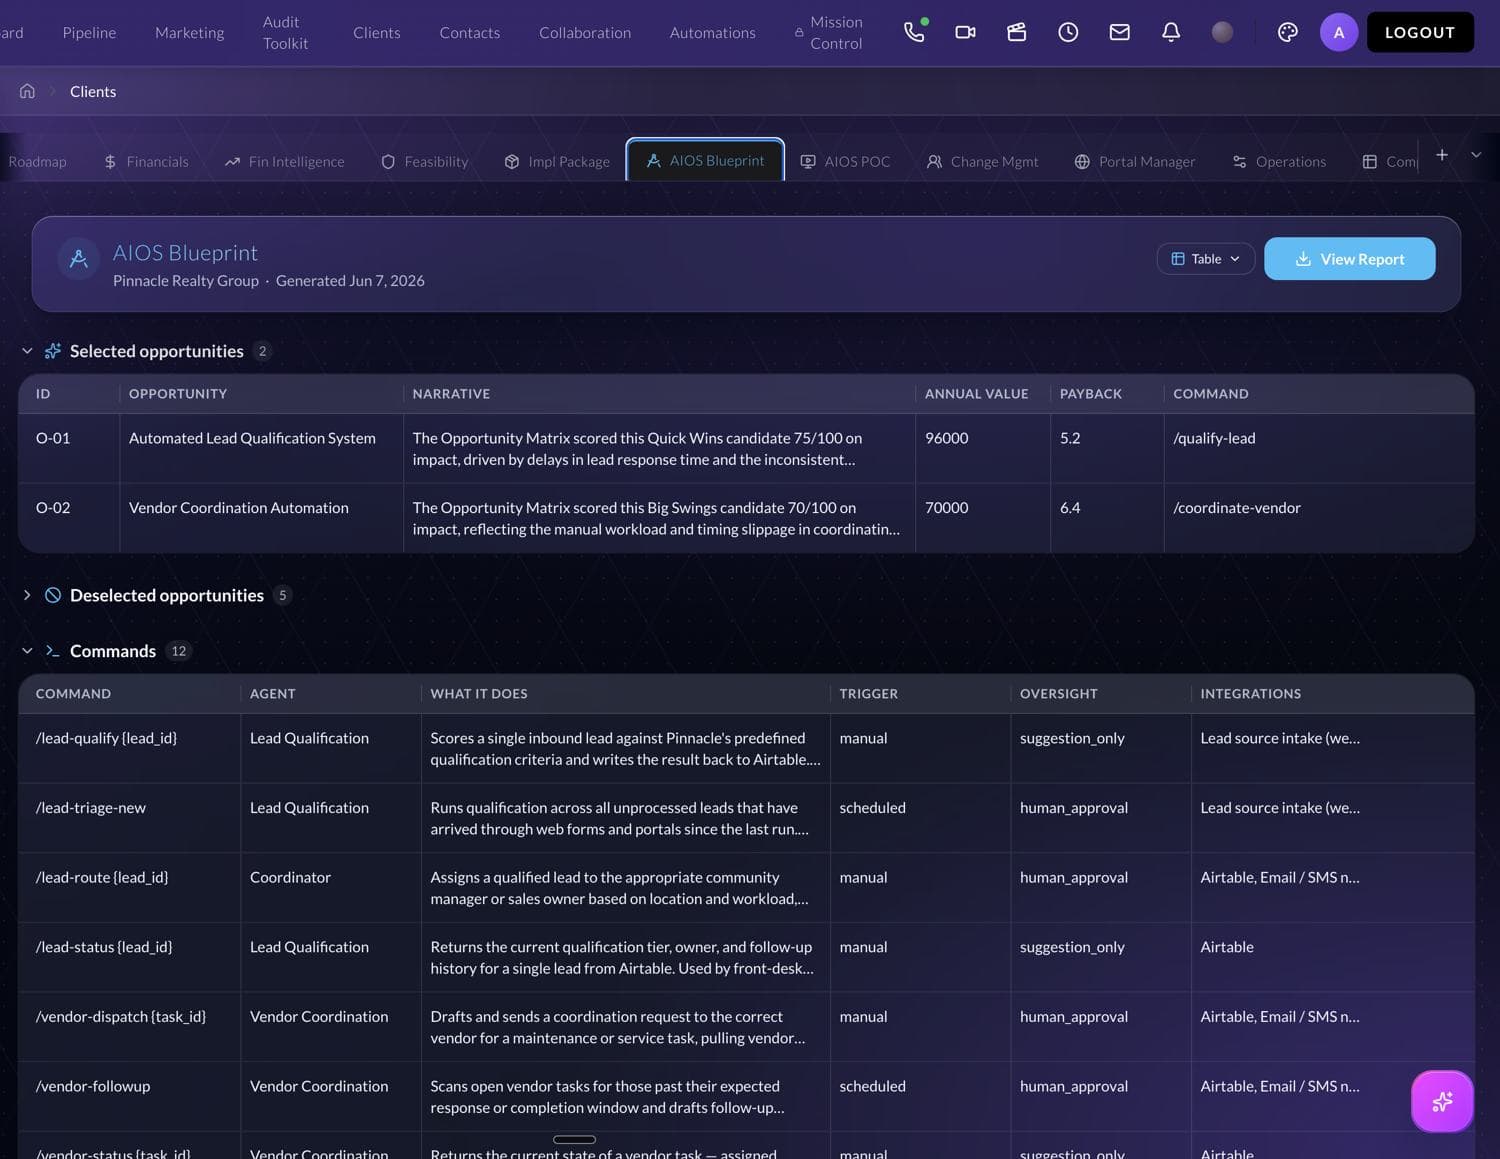
The analysis becomes a specification.
Every finding so far, the drivers, the process map, the scored solutions and the financial case, compiled into a machine-readable specification: the commands that deliver the chosen opportunities, which agent runs each one, and where a human has to approve.
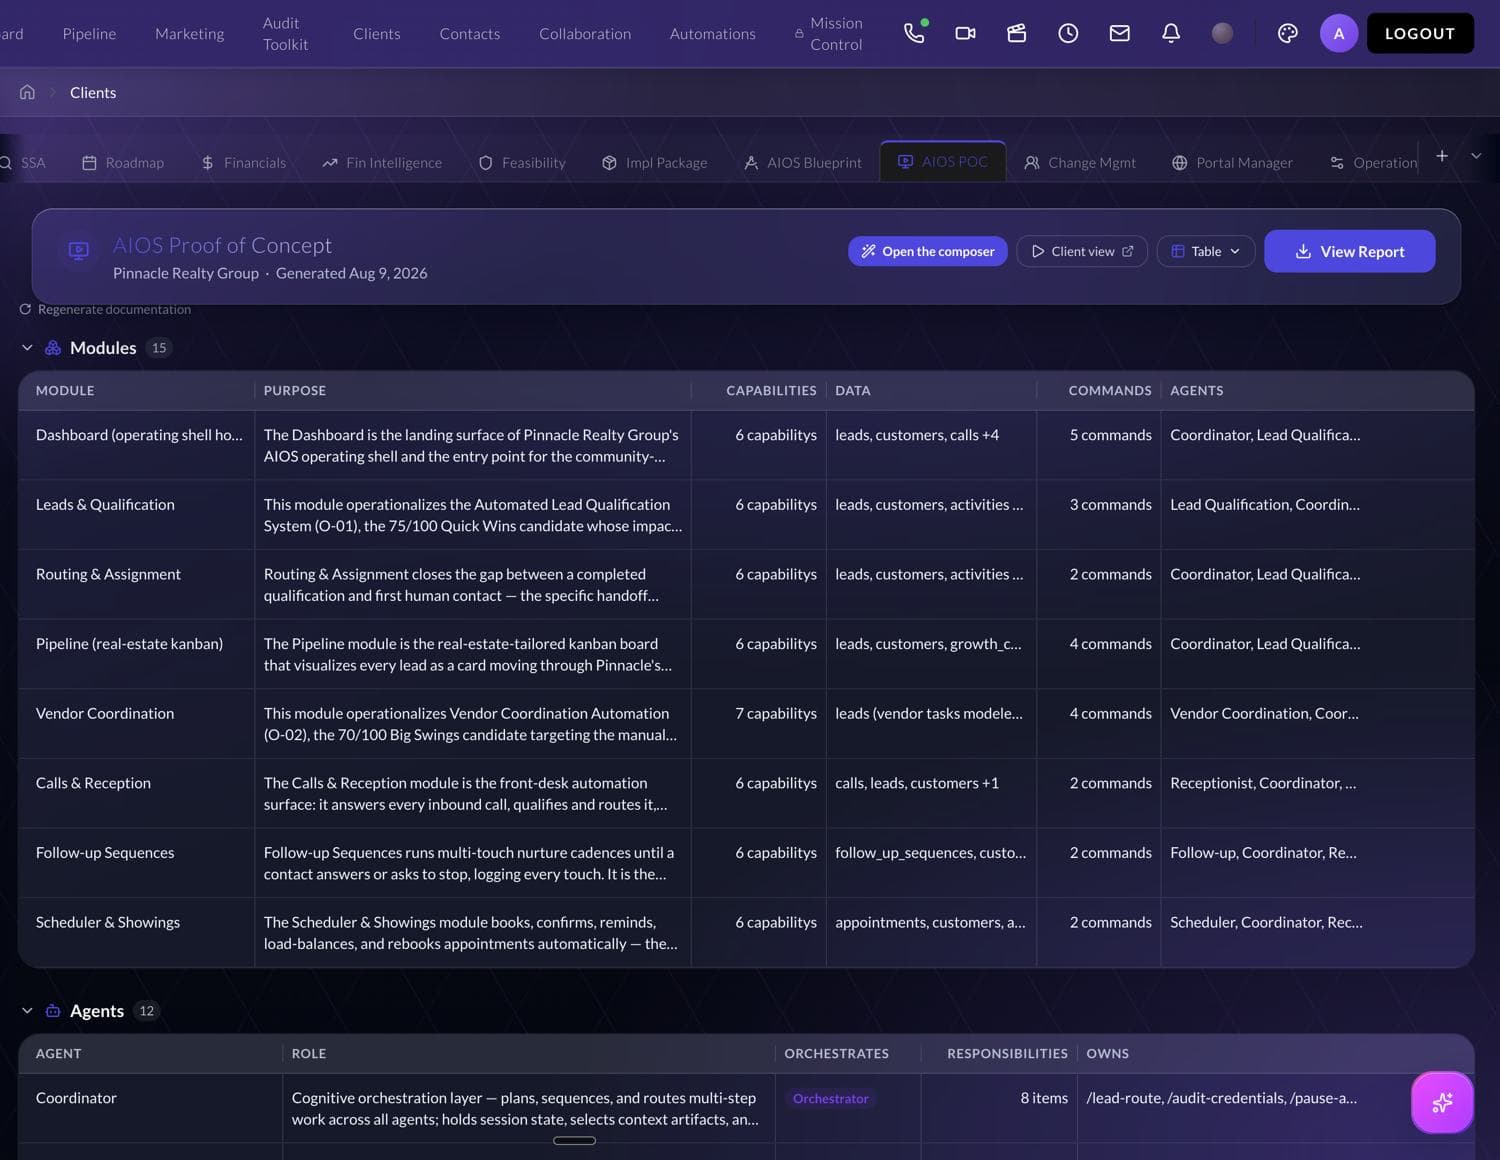
Then it becomes software.
Fifteen modules and twelve agents, documented from the blueprint, with a composer the consultant uses to change anything in plain language.
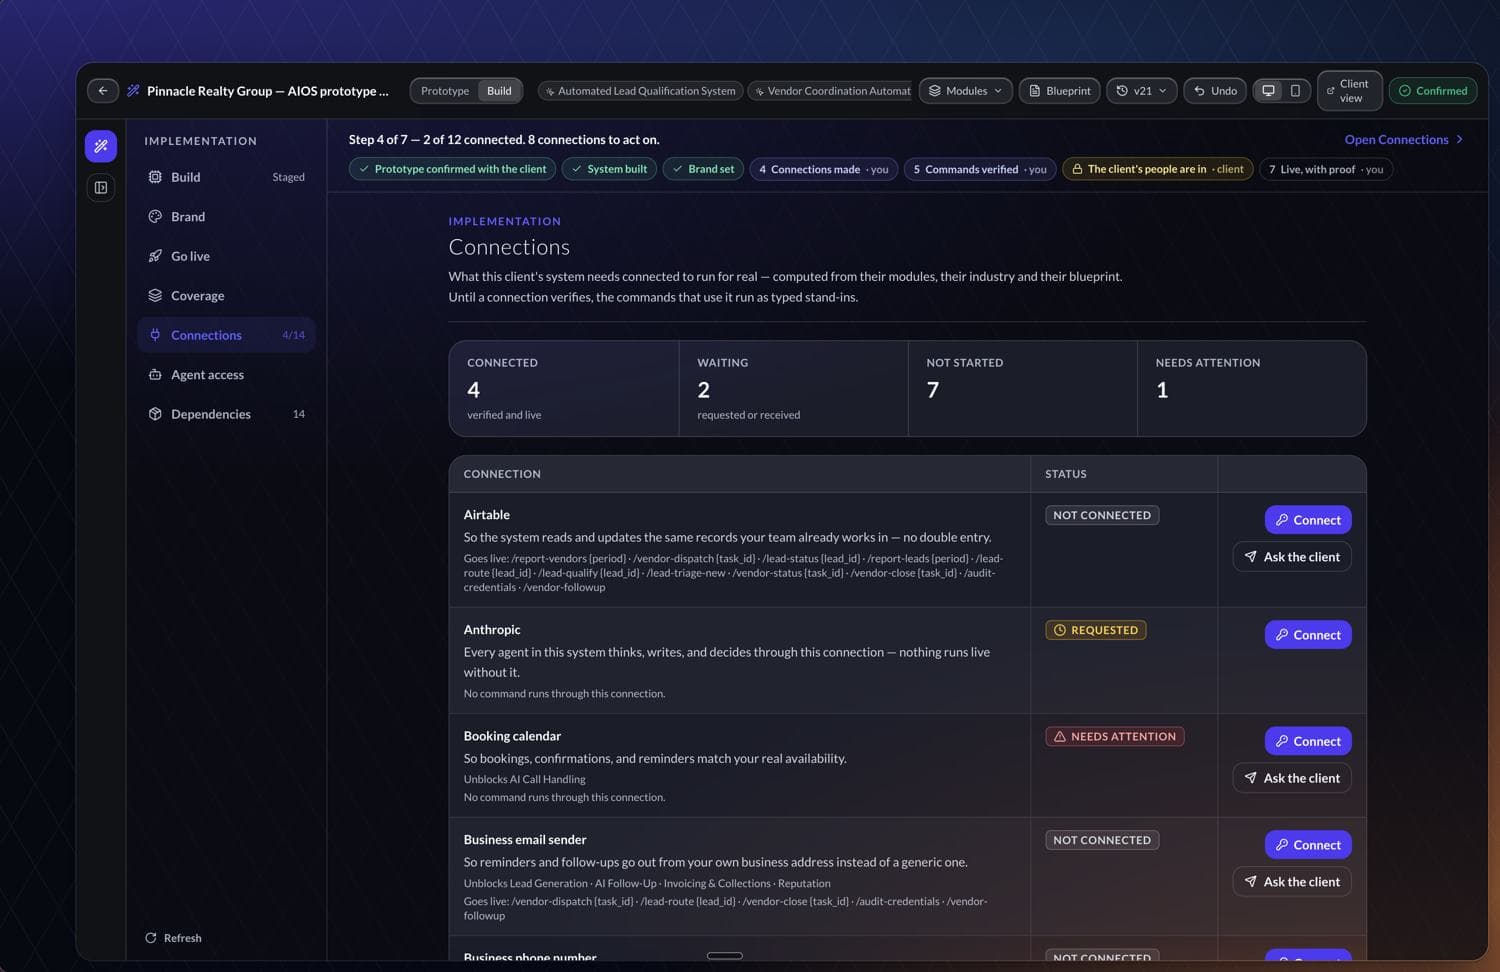
Connected to the systems the client already uses.
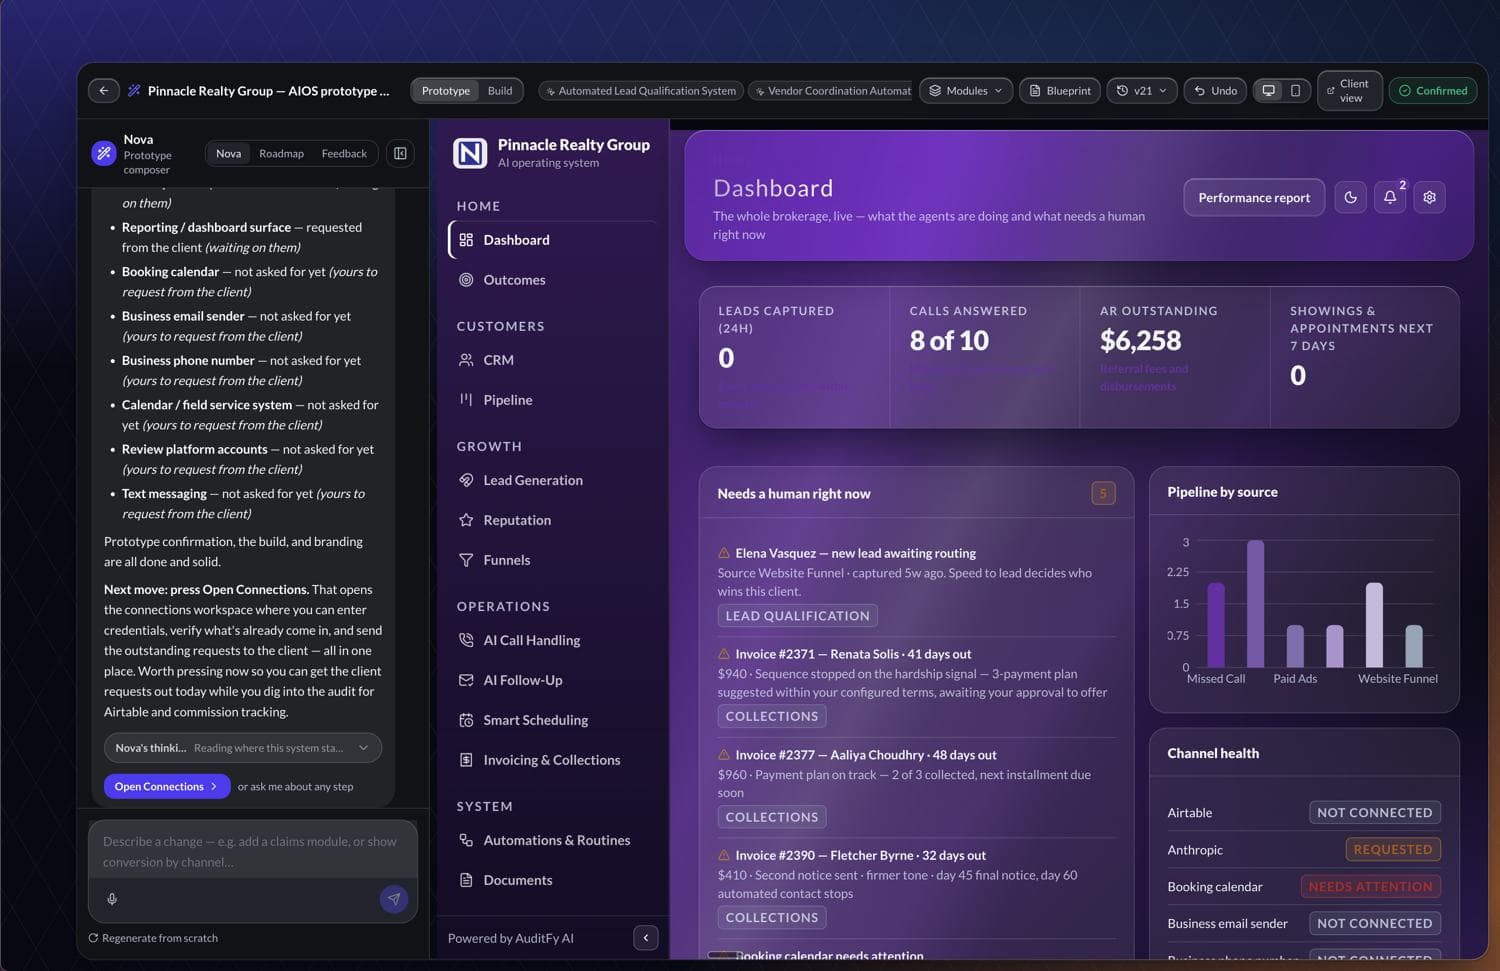
Airtable, calendar, email, phone. Until a connection verifies, its commands run as typed stand-ins, so nothing pretends to be live.
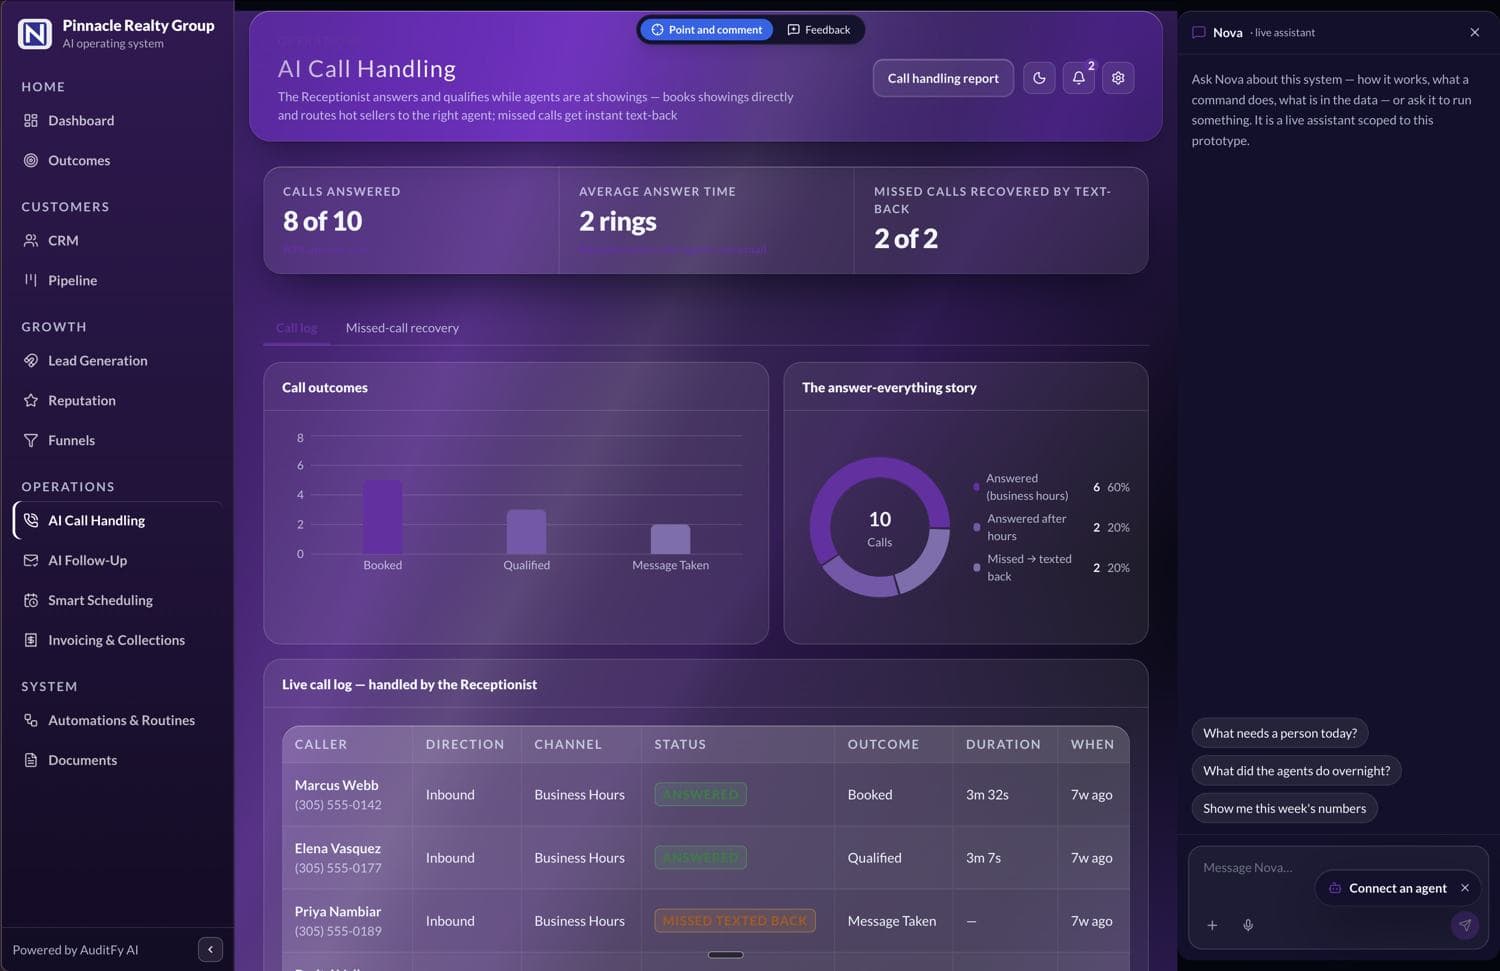
The client's business, live. What the agents are doing and what needs a person right now.
This is what the client opens every morning. It is not a dashboard about the plan. It is the plan, running, under the consultant's brand.